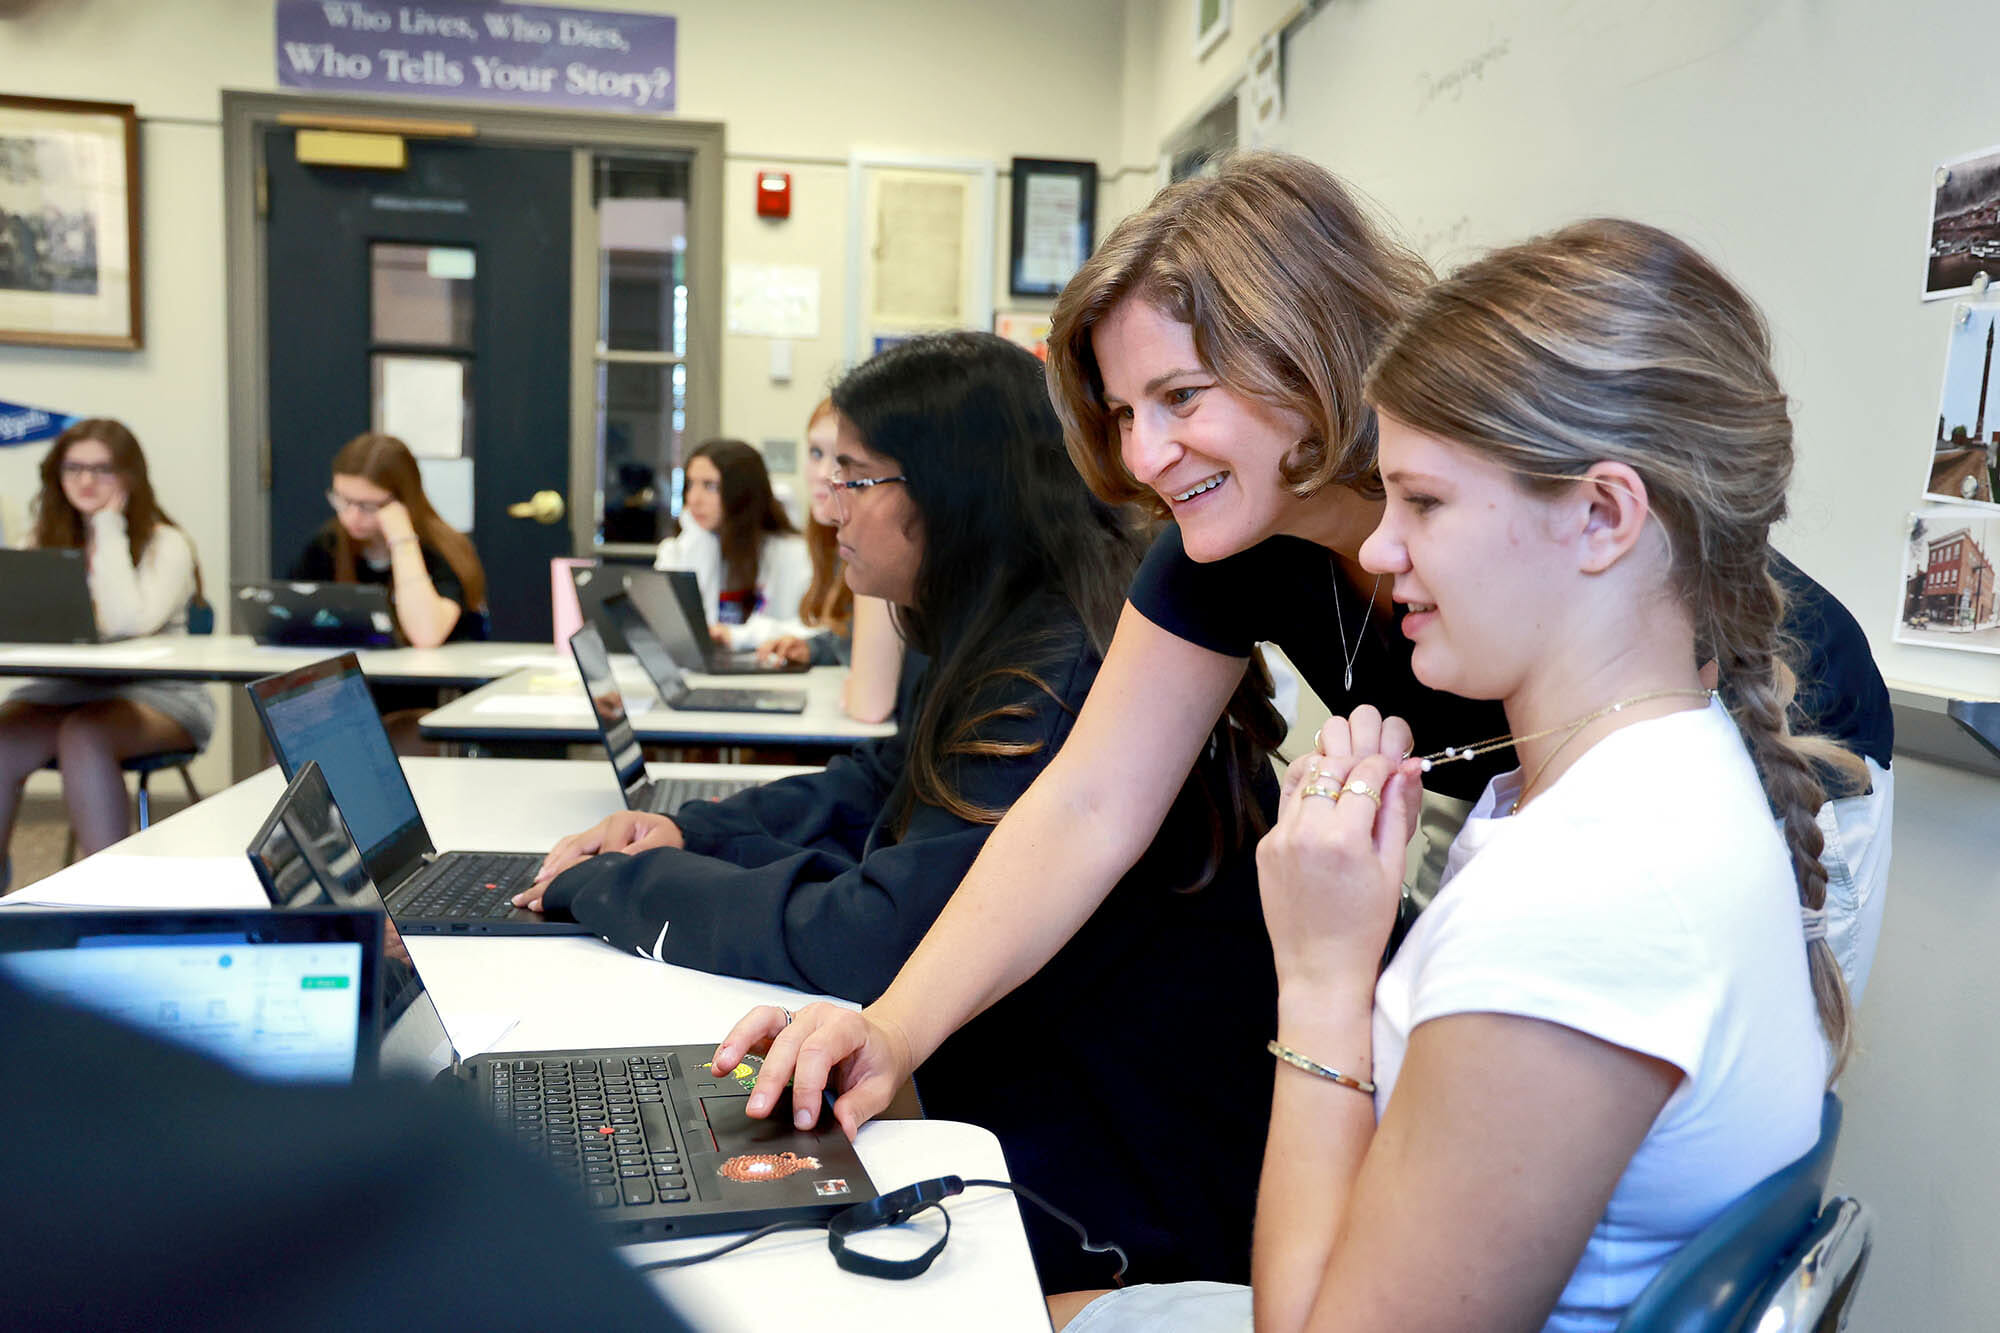
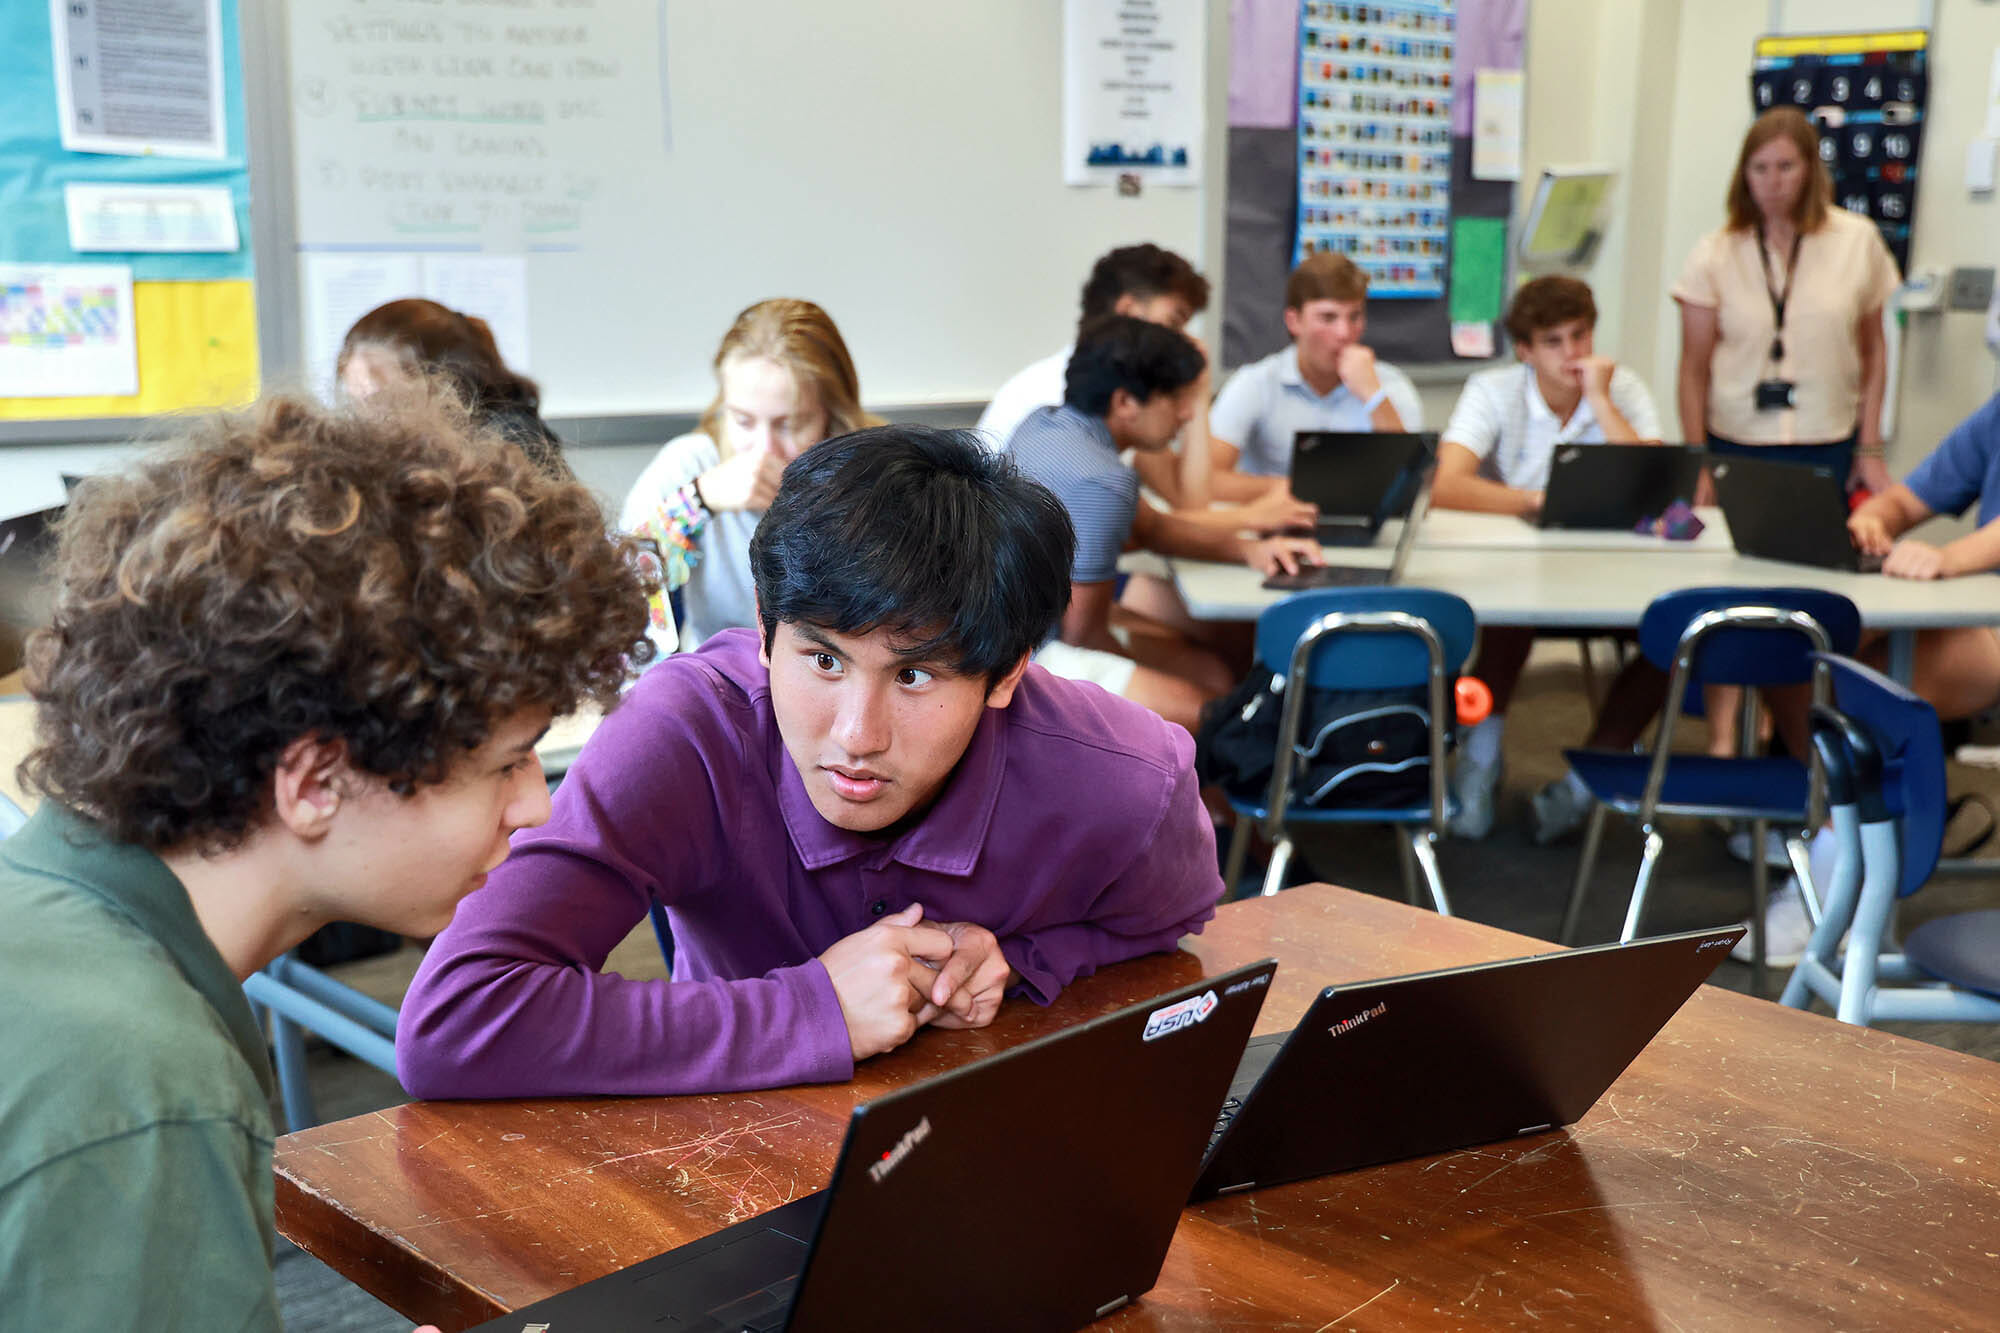
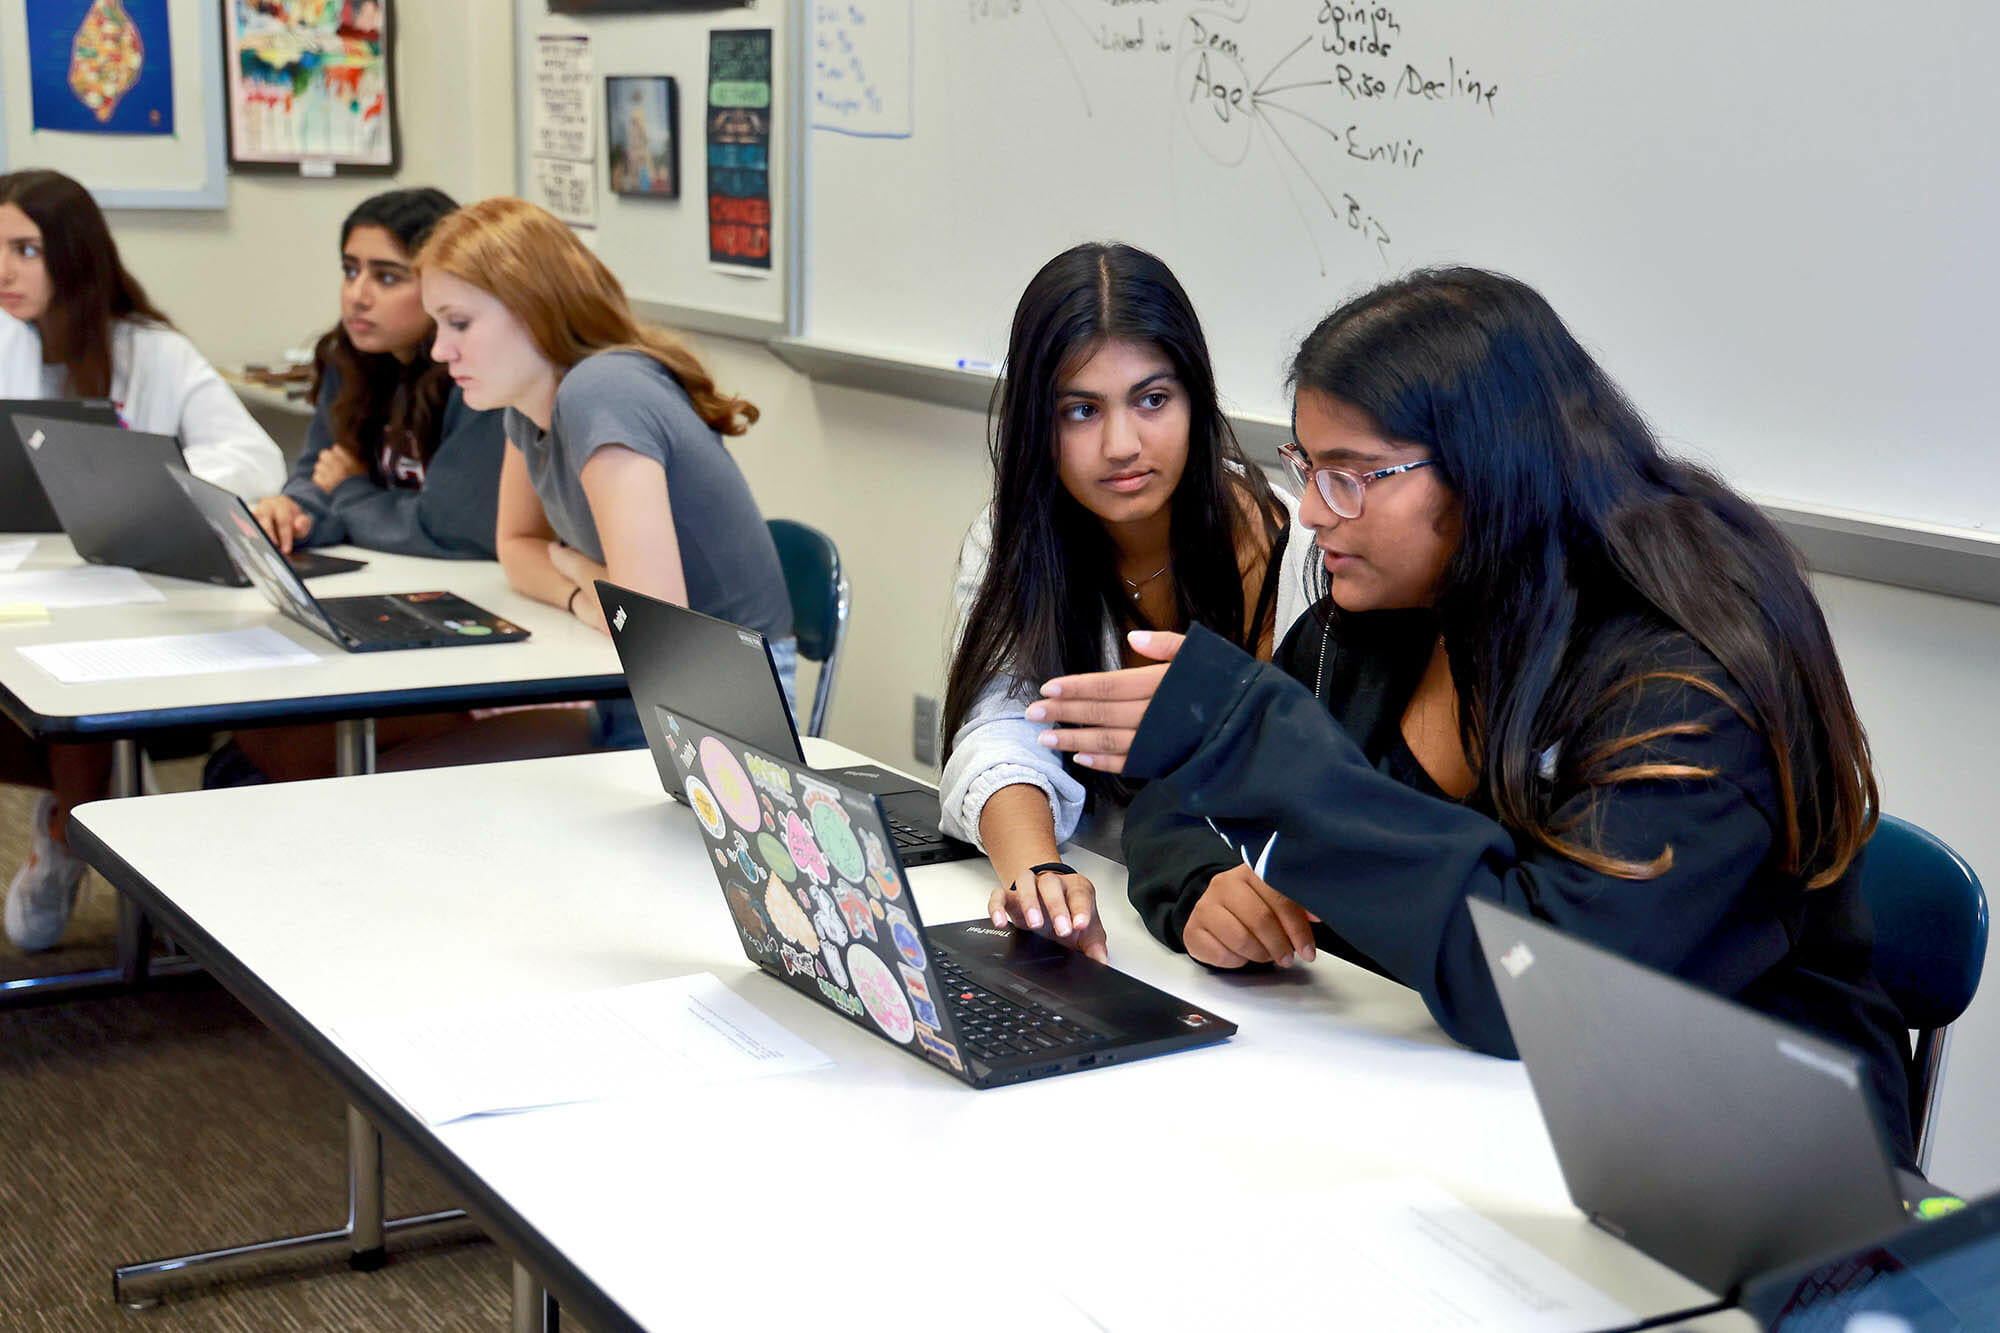
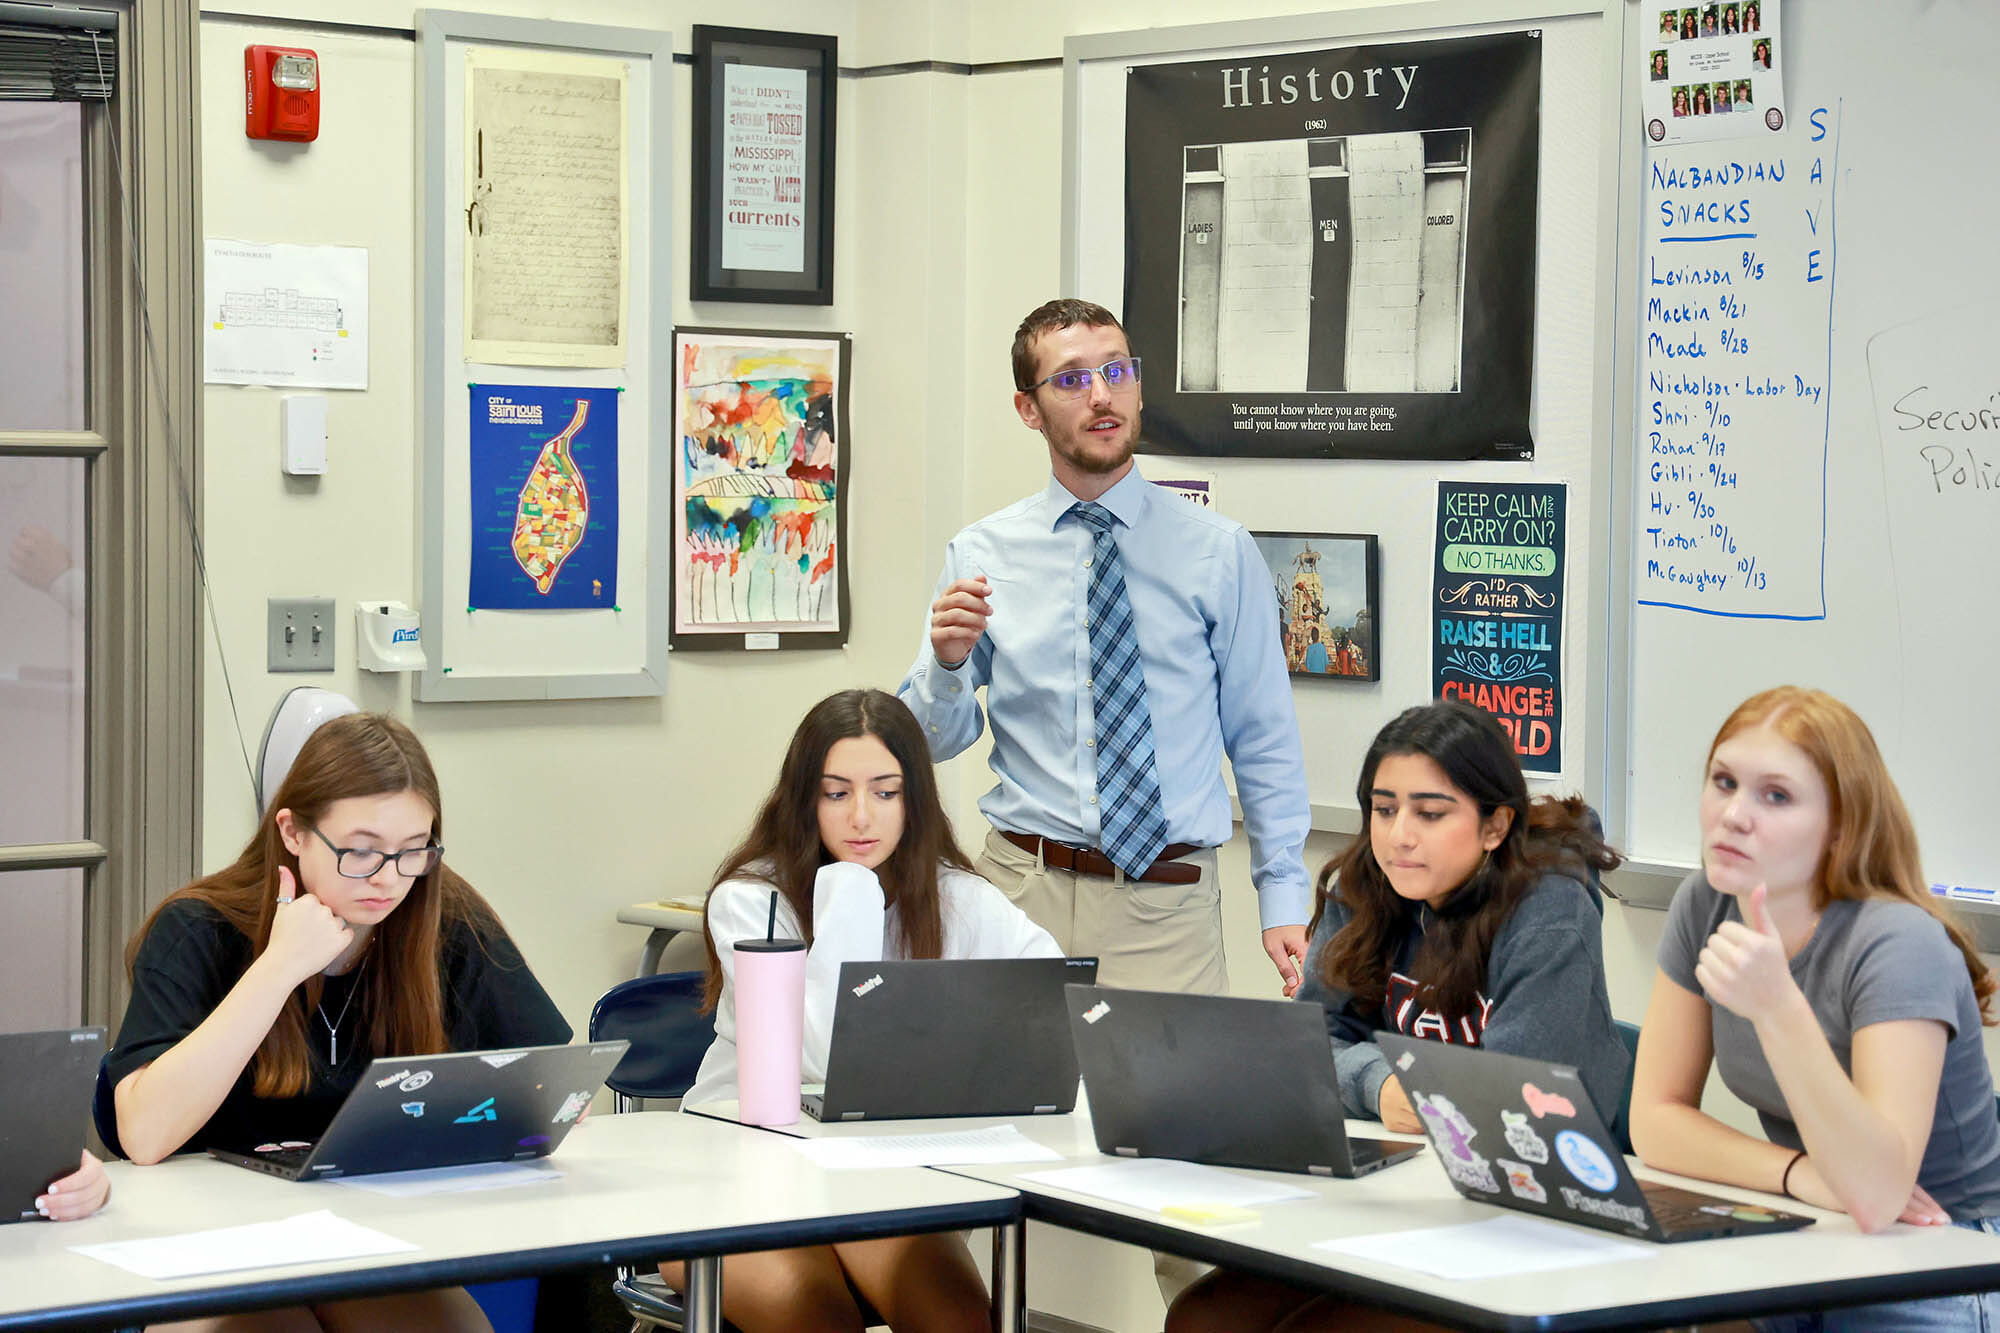
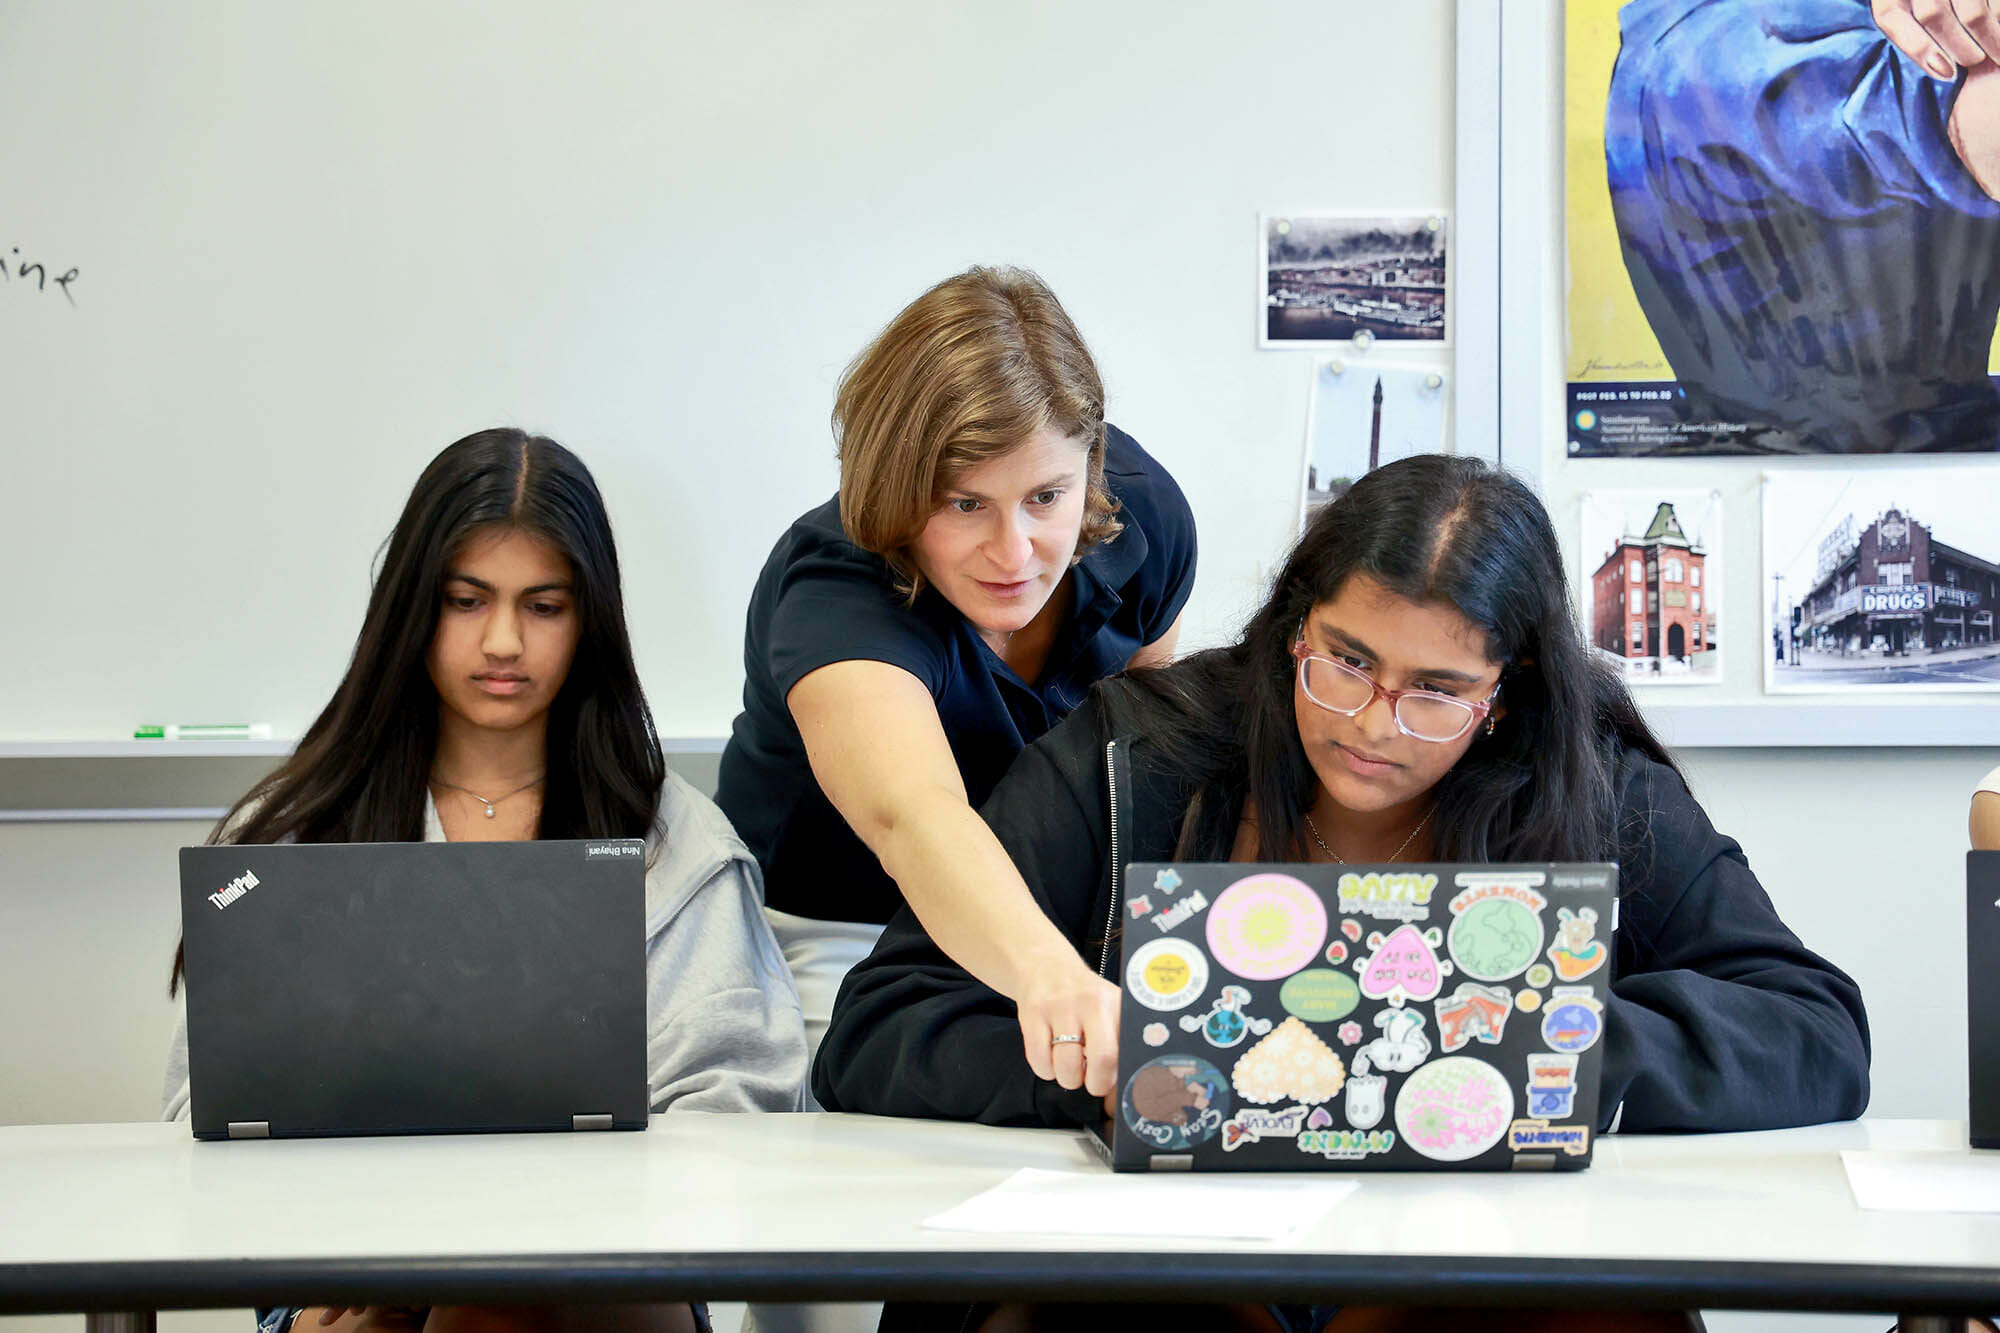
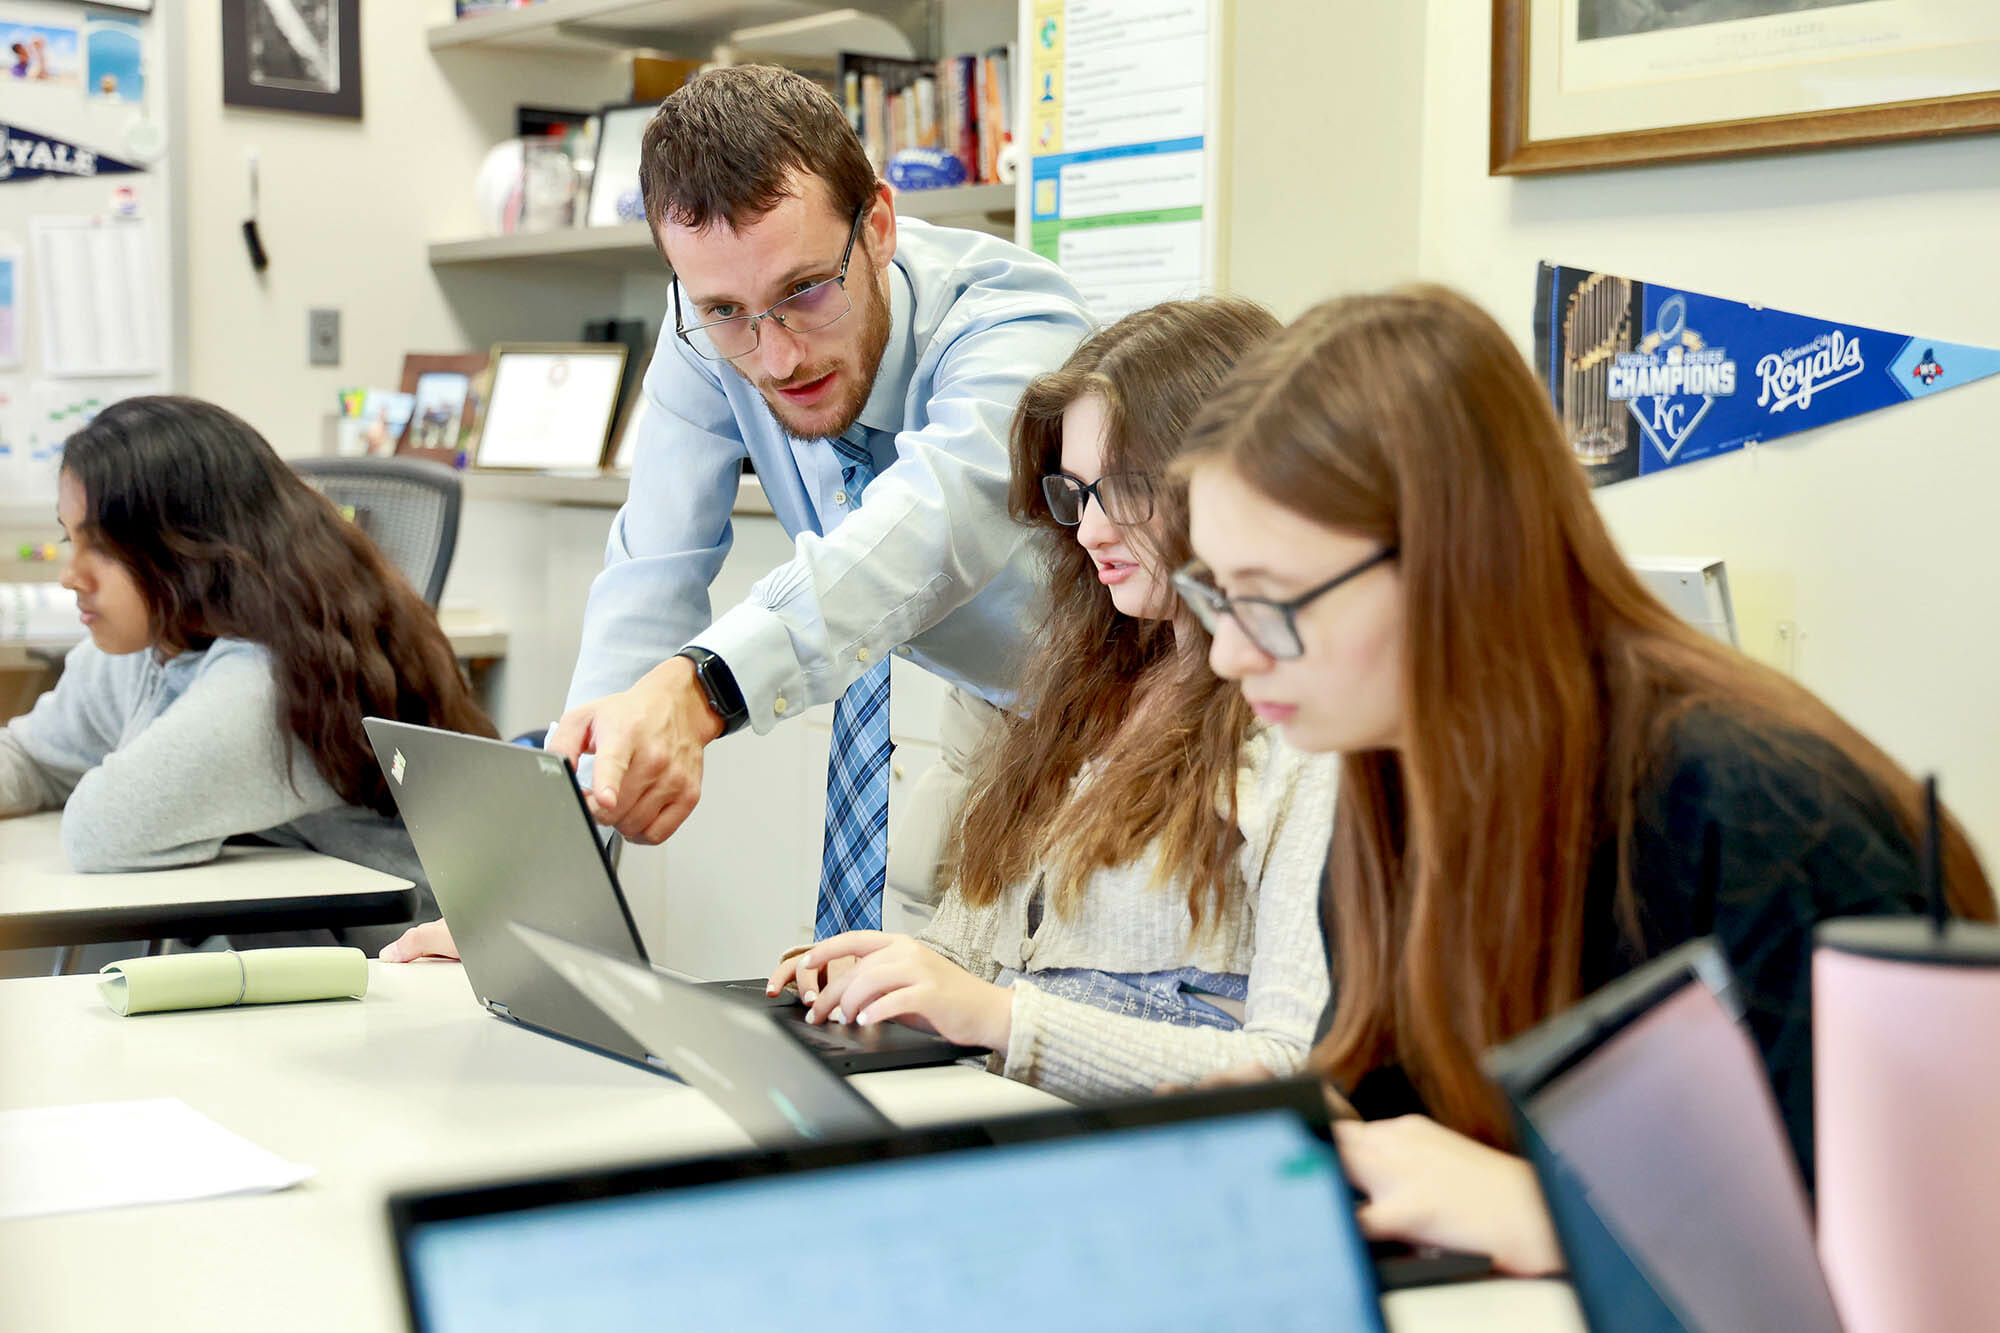
Eleventh-grade students started their History of St. Louis class by sharing their perspectives on the region. Each class discussed their thoughts and debated points on various sociological topics. A classroom is a small group to survey, though, so the teachers opened their horizons by challenging them to ask a wider audience. As a result, students explored whether age, gender, zip code, or ethnicity influence how residents see the St. Louis region.
Each student surveyed two people who aren’t related to MICDS in any way. Beyond basic demographic questions needed to determine their hypothesis, they asked questions like:
- The median household income in the St. Louis region is $97,200, according to the St. Louis Community Development Administration. Does the interviewee think that their household income is above the median, around the median, or below the median? (Interviewees could also decline to answer.)
- How long has your interviewee lived in St. Louis as a percentage of their life?
- On a scale of 0 to 5, with 0 being unimportant and 5 being important, where does St. Louis fall in terms of importance as compared to other American cities?
- On a scale of 0 to 5, with 0 being fully on the decline as a city and 5 being fully on the rise as a city, where does St. Louis fall?
- For each of the following, is St. Louis doing well, struggling, or neither?
Economics
Population
Transportation
Environment
Housing
Education
Health
Security/Policing/Military
Culture
Governance - How should the money St. Louis has received be spent?
- What is the most striking aspect of St. Louis?
- What are three words your interviewee used to describe St. Louis?
The survey was designed by our History of St. Louis teachers, which includes JK-12 History and Social Sciences Department Chair Carla Federman, Jason Asher, Max Campbell, Alex Rolnick, and Elizabeth Wells. They needed some extra help, though. “The history department was incredibly fortunate to enlist the assistance of JK-12 Math Department Chair Diane Broberg and Upper School Math Teacher Travis Menghini to be our data analysis experts,” said Federman. “They were critical in helping design the assessment, test it, and look at it from a statistics point of view rather than just history and social science.”
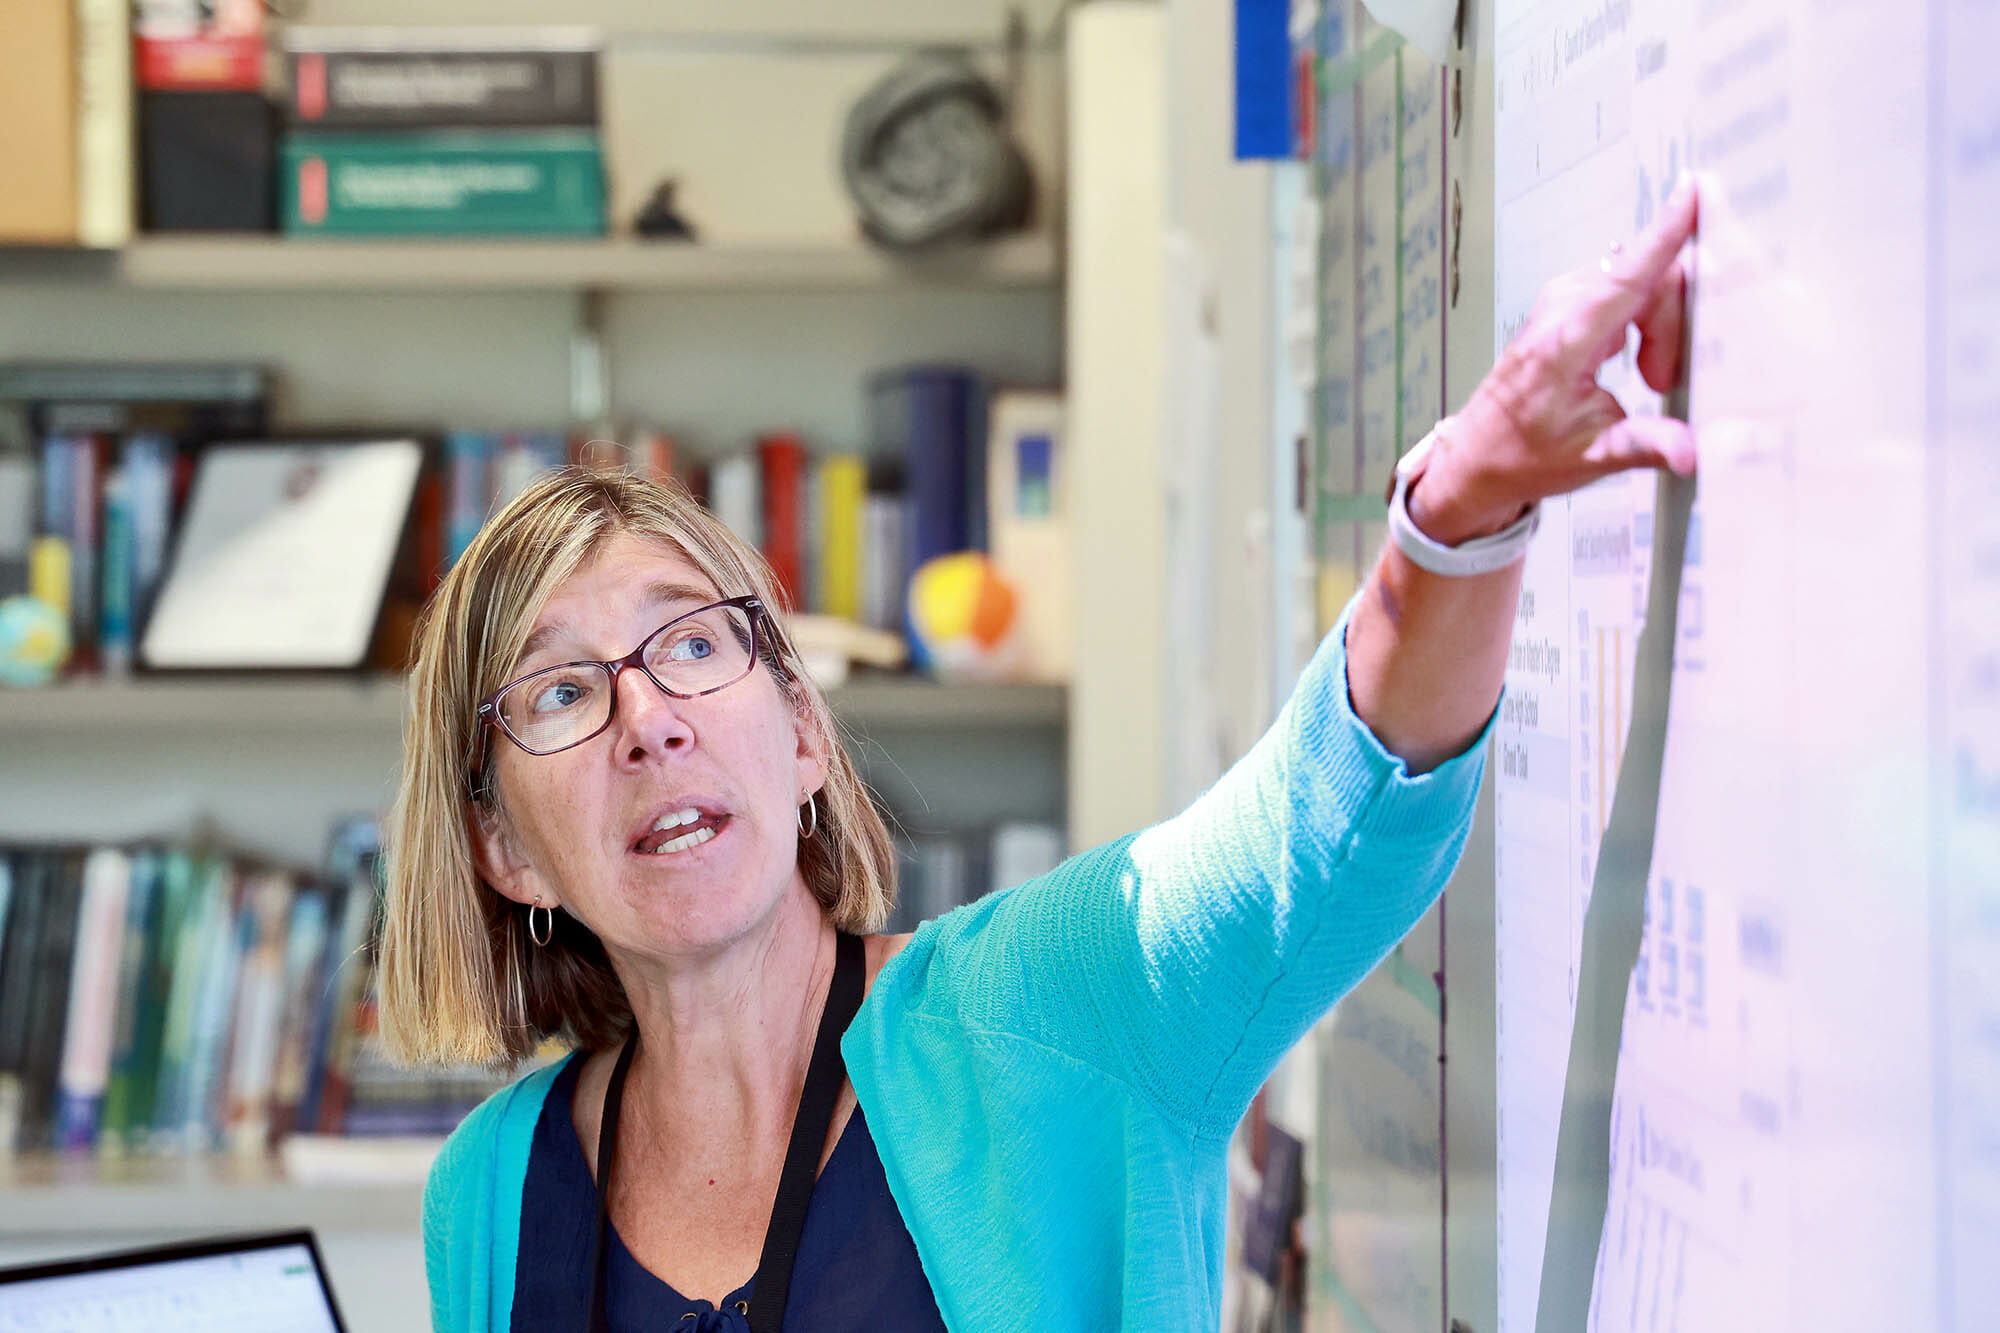
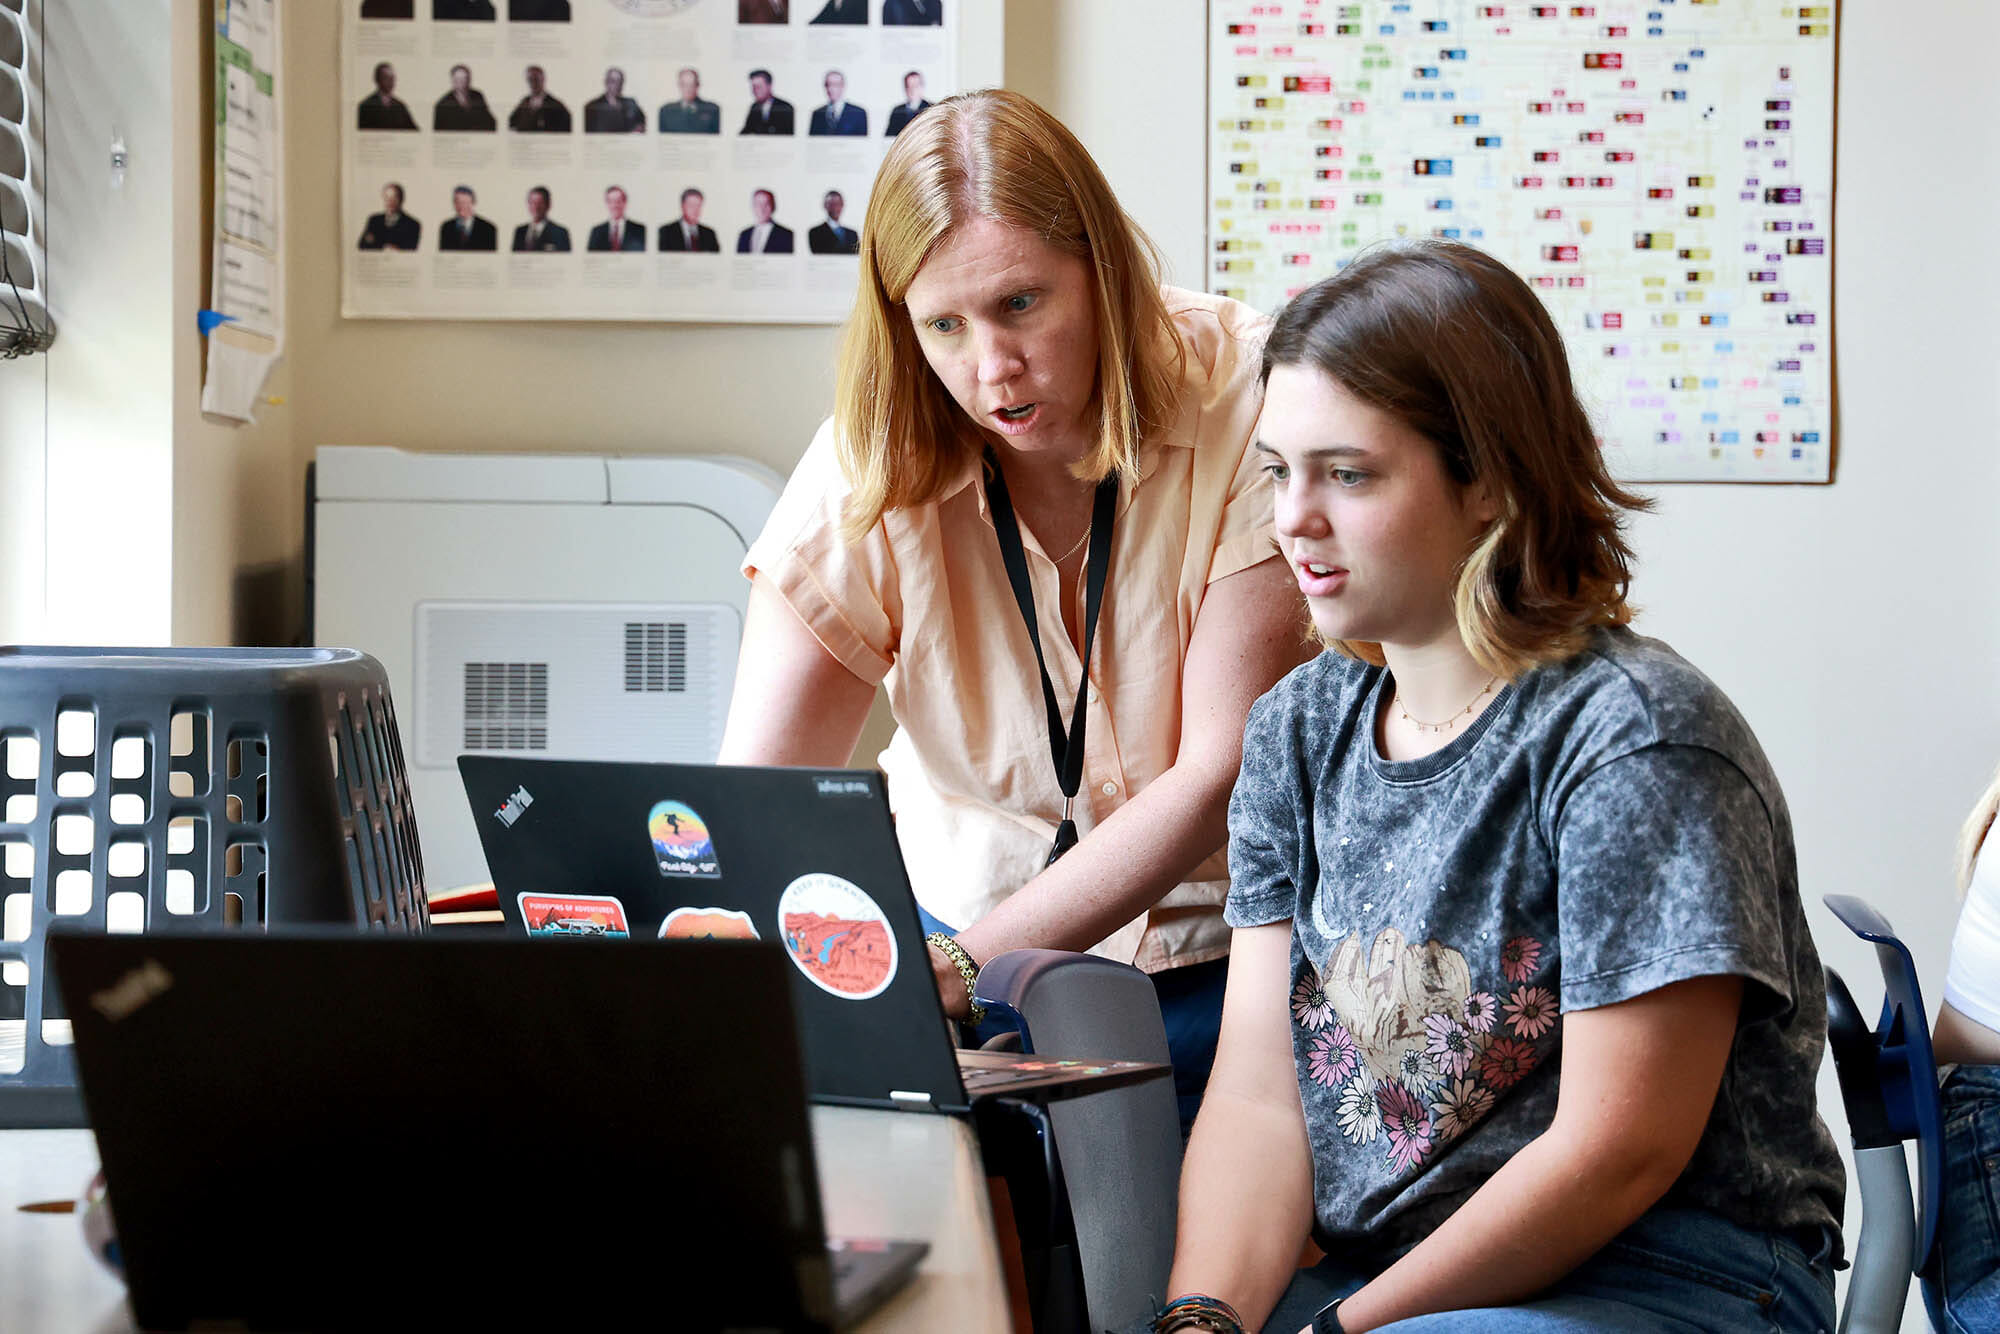
After surveying friends and family and armed with data, the history students also turned to the math teachers for help. Broberg and Menghini visited the History of St. Louis classrooms and led students through properly analyzing their data. They learned how to graph, how to make charts, and how to check whether age influences views about culture, for example.
“The goal is to get students thinking more broadly,” said Federman. “What are others’ perspectives, and how might their demographics and backgrounds influence those perspectives?” The goal of the project is to show students that they’re building a hypothesis but that they don’t have enough data to really reach concrete conclusions. “We’re really pushing them to think about this in terms of ‘what does this data set make us believe,’ and ‘what would we need to do to prove its validity,’ and ‘does this align with your own perceptions?'” said Federman.
The students then submitted individual written assessments analyzing the perceptions included in the accumulated data. They were required to focus on one particular aspect of the data they found interesting or compelling, analyze how at least one open-ended response complicates or reinforces the broader data, and compare one demographic variable to responses about multiple elements of a city (or compare responses on one element of a city to multiple demographic variables).
Students also needed to consider what their next steps would be to assess the validity of their data set and/or their argument. What questions were missing from the survey? What additional evidence would they collect? Finally, they submitted a graph or visual component that they generated using their data.
This project is a great start to the History of St. Louis class, and offers food for thought as the students learn more and more about their city and region as the semester progresses.
